As enterprise networks grow larger and more distributed, the volume of operational data they generate continues to rise. Devices across the infrastructure constantly produce alerts, logs and performance metrics. While this data is essential for monitoring network health, it can quickly become overwhelming when every system reports events in its own format.
For tech teams, the challenge is no longer just collecting this data, it’s making sense of it in a way that enables faster and more informed operational decisions. Without the right mechanisms in place, critical signals can easily get buried within a flood of alerts.
This is where a Network Management System (NMS) becomes essential. Behind the scenes, it relies on a structured data pipeline that ingests events from across the network, standardizes them, and correlates related signals to provide a clearer view of what is happening across the infrastructure.
In this blog, we explore how event normalization and correlation within an NMS pipeline help transform large volumes of network alerts into clear, actionable operational insights.
An NMS collects data from multiple sources across the network to monitor performance, detect failures, and analyze traffic. However, this data is often noisy, fragmented, and generated in different formats, making it challenging to process and correlate.
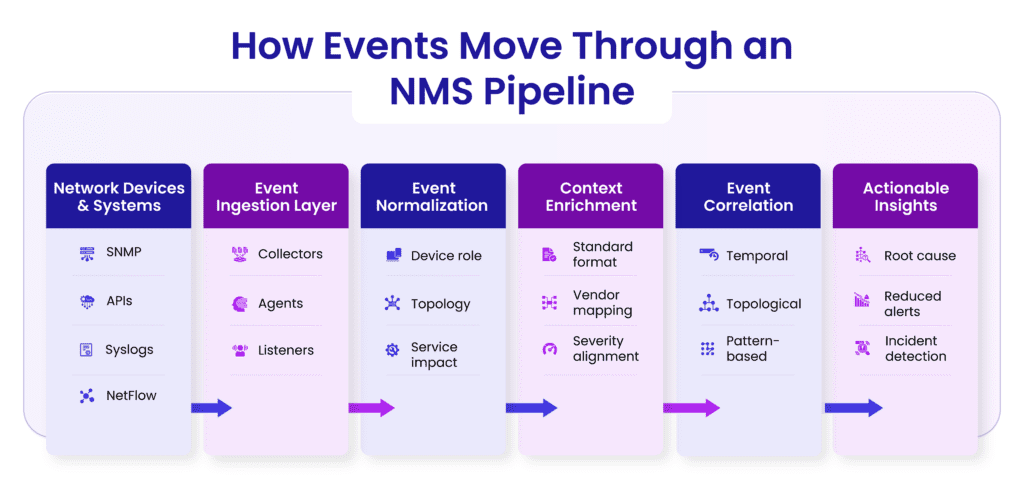
The Event Ingestion Layer is the first processing stage in NMS. Its role is to receive, buffer and organize massive volumes of incoming network events before they are processed or analyzed. Since network devices continuously generate alerts, logs, and metrics, this layer must be designed to handle high-velocity, unpredictable data streams without losing critical information.
To gather data from different sources, the ingestion layer uses components such as collectors, agents and listeners.
These components ensure that data from various protocols and systems can be captured reliably and funneled into a unified pipeline.
Network data can be ingested using two main approaches:
Network events rarely arrive at a steady pace. During outages or configuration changes, thousands of alerts can be generated within seconds.
The ingestion layer must handle:
Techniques such as buffering, queuing systems, rate limiting, and deduplication help maintain data integrity during these situations.
Accurate timestamps are critical for analyzing network events. However, devices in large networks may have different clocks, time zones, or synchronization settings.
Common challenges include:
To address this, NMS systems often normalize timestamps using centralized time sources such as NTP and adjust events during ingestion to maintain a consistent timeline.

In an NMS, event normalization is the process of converting raw, inconsistent data from different network devices into a standardized and structured format. Since devices from different vendors generate logs and alerts in their own formats, normalization ensures that all events can be understood, compared and analyzed in a consistent way.
Standardizing Event Formats: Network events often arrive in different structures, some as unstructured logs, others as structured messages. Normalization converts these into a uniform format, ensuring that fields like timestamp, event type, device ID and severity follow a consistent structure across all events.
Mapping Vendor-Specific Fields to a Common Schema: Different vendors use different names and formats for similar information. For example, one device might label a field as interface status, while another might use port state. Normalization maps these vendor-specific fields into a common schema, allowing the NMS to interpret them in the same way.
Severity Normalization: Not all devices interpret severity levels the same way. An alert marked as “critical” by one vendor might represent a different level of urgency compared to another. Normalization aligns these severity levels into a standard severity scale, ensuring consistent prioritization across the network.
Enrichment with Metadata: During normalization, events are often enriched with additional context such as:
This added metadata helps transform simple alerts into context-aware events.
Why It Matters
Raw network events often lack the context needed to understand their real impact. Context enrichment enhances these events by adding relevant information about devices, topology, services, and operational conditions. This helps transform simple alerts into actionable insights.
Event correlation is the process of analyzing multiple alerts together to understand how they are related and identify the actual root cause of an issue. Instead of investigating hundreds of separate alerts, correlation helps group related events and show what is truly causing the problem.
Real-Time Processing vs Historical Analysis
Effective event correlation requires both real-time processing for immediate incident response and historical analysis to continuously improve detection accuracy. Together, these approaches help organizations react quickly to current problems while also learning from past incidents.
Stream Processing for Live Incidents
Stream processing focuses on analyzing events as they are generated in real time. Instead of storing data first and analyzing it later, the system processes incoming events immediately as part of a continuous data stream.
This enables monitoring platforms to detect patterns, correlate alerts, and identify potential incidents within seconds of events occurring. Real-time stream processing is essential for environments where delays in detection could impact service availability, user experience, or operational continuity.
By processing data continuously, operations teams can receive instant insights and alerts, allowing them to respond to issues before they escalate.
Event Stores and Time-Series Databases
While real-time processing handles live data, organizations also need to store and organize event data for analysis and auditing. This is typically done using event stores or time-series databases that are optimized for handling large volumes of time-based data.
These systems record events along with their timestamps, enabling teams to analyze how incidents evolved over time. Time-series storage also allows monitoring tools to track trends, detect anomalies, and compare current system behavior with historical patterns.
Having a structured event history is critical for investigating incidents, identifying recurring issues, and improving system observability.
Learning from Past Incidents to Improve Correlation Rules
Historical event data provides valuable insight into how incidents develop and propagate across systems. By analyzing past incidents, organizations can refine correlation rules and detection logic.
This process helps identify patterns that were previously missed, reduce false positives, and improve the accuracy of incident detection. Over time, the correlation system becomes smarter and more effective at distinguishing between normal system behavior and genuine operational problems.
Learning from historical incidents ensures that the monitoring pipeline continuously evolves and becomes better at identifying root causes rather than just symptoms.
As IT environments grow in size and complexity, event pipelines must be designed to handle large volumes of data while maintaining reliability and performance. Scaling the pipeline effectively ensures that monitoring and correlation systems remain responsive even under heavy workloads.
Horizontal scalability refers to the ability to increase system capacity by adding more processing nodes rather than upgrading a single machine. Distributed event pipelines can process large volumes of events by spreading the workload across multiple nodes or services.
This approach allows systems to handle spikes in event traffic without performance degradation. As infrastructure grows, additional processing capacity can be added seamlessly to maintain consistent event processing performance.
In high-volume event pipelines, failures can occur due to system crashes, network interruptions, or processing overloads. Fault tolerance mechanisms ensure that the system continues operating even when individual components fail.
Back-pressure handling is another important aspect of reliability. When downstream systems become overloaded, back-pressure mechanisms help regulate the flow of incoming data so that processing components are not overwhelmed.
Together, these strategies ensure that the pipeline remains stable, resilient, and capable of handling sudden bursts of event data.
Event processing systems often need to balance speed and analytical depth. Low latency enables faster incident detection, but deeper analysis may require additional processing time. Designing an effective pipeline involves finding the right balance between rapid alert generation and accurate correlation results. Systems must ensure that alerts are generated quickly while still providing meaningful insights into the root cause.
Event processing pipelines can be deployed using cloud-native architectures or traditional on-premises infrastructure.
Cloud-native architectures offer advantages such as elastic scalability, managed services, and easier deployment of distributed systems. These environments allow organizations to dynamically scale processing resources based on event volumes.
On-prem architectures, on the other hand, provide greater control over infrastructure, data governance, and security requirements which may be critical for certain industries.
The choice between these architectures depends on factors such as organizational requirements, data sensitivity, scalability needs and operational complexity.
A well-designed Network Management System (NMS) pipeline ensures that events from different monitoring tools are collected, processed, and analyzed efficiently. The goal is to transform large volumes of raw alerts into clear, actionable insights that help operations teams quickly identify and resolve issues.
As networks scale and infrastructure becomes increasingly distributed, the real challenge is no longer collecting alerts but making sense of them quickly and accurately. Event normalization, enrichment, and correlation form the backbone of a modern NMS pipeline, reshaping noisy network signals into clear operational insights.
Solutions like Percipient NMS bring these capabilities together in a unified platform, thus enabling real-time monitoring, intelligent event correlation, and faster root-cause identification across complex, multi-vendor environments. By turning raw network data into actionable intelligence, organizations can move from reactive troubleshooting to proactive network operations.
Want to see how Percipient NMS simplifies large-scale network monitoring? Explore the platform or schedule a demo to experience it in action.

Technical Content Writer
Driven by a passion for storytelling and technology, I translate complex concepts into clear, impactful narratives. My work revolves around exploring emerging trends, digital transformation, and innovation across industries. With a strong curiosity for tech-driven knowledge and a love for reading, I’m always seeking new ideas that inspire smarter communication and deeper understanding.
info@echelonedge.com
marketing@echelonedge.com


Copyright ©2023 Echelon Edge Pvt Ltd | All Right Reserved | Cookies Policies