The networks become more distributed, hybrid and AI-driven, the visibility challenges facing IT teams are intensifying rapidly. Traditional monitoring approaches are no longer enough to keep pace with cloud expansion, IoT proliferation, encrypted traffic and escalating performance expectations. In 2026, the biggest risks to uptime, security and user experience won’t come from device failures but from the invisible blind spots lurking across the network.
In this blog, we break down the 10 most critical visibility gaps IT leaders must confront to stay resilient, proactive and future-ready.

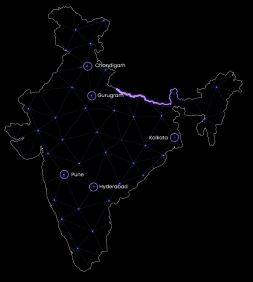
Most IT teams continue to struggle with true end-to-end visibility because traditional monitoring tools only reveal device-level availability not how traffic actually moves through the network. As hybrid networks combine on-prem, WAN, SD-WAN and cloud components, hop-by-hop tracing becomes increasingly unreliable. Encrypted tunnels, vendor-managed segments, and dynamic routing decisions further obscure the real path packets take.
As a result, when a performance issue emerges, teams often spend more time identifying where the slowdown is happening than resolving it. This lack of path clarity turns troubleshooting into a manual, time-consuming exercise and often pushes MTTR beyond acceptable limits, eventually affecting SLA commitments as well.
With organizations distributing applications across AWS, Azure, GCP and private cloud platforms, visibility has become fragmented. Each cloud provider exposes telemetry in its own format, with its own refresh cycles, dashboards, and monitoring limitations. The result is a patchwork of insights rather than a single, coherent understanding of how cloud networks behave.
Critical elements like VPC connectivity, inter-region traffic, or cloud-to-data-center links, often sit outside traditional NMS coverage, creating blind spots that surface only during incidents. When teams need to troubleshoot, they’re forced to jump between dashboards and manually correlate logs, which slows down diagnosis and increases the likelihood of performance issues going unnoticed until they affect end users.
As enterprises and smart-city ecosystems expand into distributed locations, branch offices, warehouses, signal junctions, remote gateways, and micro-data centers, most of these sites operate with minimal monitoring. Many edge devices are bandwidth-constrained or don’t support standard telemetry protocols, making it difficult to capture meaningful health and performance data. This leaves IT teams with limited insight into what’s happening outside the core network.
When a gateway fails, a sensor disconnects, or connectivity degrades due to local issues, it often goes undetected until it impacts services or triggers complaints from the field. The challenge is magnified by the operational cost of dispatching engineers to physical locations just to understand the root cause, making remote-site observability one of the biggest barriers to maintaining a resilient distributed network in 2026.

As organizations shift toward stronger security standards like TLS 1.3 and encrypt more east-west traffic within the network, visibility becomes increasingly limited. While encryption is essential for protecting data, it also hides the very traffic patterns that security and network teams need to understand. Traditional monitoring tools struggle to inspect or analyze this encrypted flow without degrading performance or violating compliance policies.
As a result, critical anomalies such as lateral movement, unexpected surges or misrouted traffic, go unnoticed. This creates a paradox where networks are more secure on paper but more opaque in practice, leading to blind spots that attackers or performance issues can exploit undetected.
Many enterprises still rely on outdated spreadsheets, manual updates, or multiple uncoordinated tools to maintain their device inventory. In rapidly scaling networks, this approach becomes unmanageable. Devices get added, retired, or reconfigured without proper documentation, leaving teams with an inaccurate or incomplete view of what actually exists in the network.
During outages, this lack of real-time inventory slows down troubleshooting because engineers can’t instantly determine device status, configuration history, or ownership. Audits and compliance checks become even more challenging, often revealing discrepancies that could have been avoided with automated, unified inventory visibility. The fragmentation not only wastes time, it introduces operational risk at every stage of network management.
IoT and OT devices have become essential in industries like manufacturing, utilities, smart cities, and public safety, but they behave very differently from traditional IT assets. Many of these devices run proprietary protocols, emit limited telemetry, or communicate intermittently, making them difficult to integrate into standard monitoring frameworks. Without real-time insight into their health, performance, or connectivity, teams often remain unaware of failures until services degrade or stop entirely.
The challenge intensifies in large deployments, thousands of sensors, cameras, and controllers across dispersed environments where even a small percentage of silent or misbehaving devices can affect outcomes. This lack of visibility leaves organizations vulnerable to downtime, data gaps, and operational inefficiencies that can ripple across entire systems.
Many networks still lack deep flow-level visibility such as NetFlow or IPFIX data, which limits how effectively teams can understand traffic behavior. Without these insights, it becomes nearly impossible to pinpoint where congestion originates, which applications are consuming disproportionate bandwidth, or whether any unusual patterns indicate misuse or potential threats.
Instead, teams rely on high-level metrics that only show symptoms, not causes. Flow data is what reveals the dynamics inside the network, who is talking to whom, how much, and why. Without it, IT teams operate with blurred vision, making performance optimization reactive and guesswork-driven rather than precise and evidence-based.
Modern networks generate massive amounts of data, logs from firewalls, metrics from devices, events from applications but these data streams often live in separate tools and lack meaningful correlation. During incidents, teams jump between screens, export reports, or manually stitch together clues to understand what actually happened.
The absence of a unified narrative slows down root cause analysis and leads to conflicting interpretations of the same issue. When logs, metrics, and events don’t speak to each other, visibility becomes fragmented and noisy which makes it difficult for teams to differentiate real problems from background chatter. This gap turns incident response into a prolonged investigation instead of a swift, decisive resolution.
Despite the growth of managed services and vendor-dependent networks, many IT teams still handle SLA monitoring manually collecting reports, exporting logs as well as creating monthly summaries. This approach is slow, error-prone, and often reveals SLA breaches only after they’ve already impacted customers or operations.
Without automated, real-time SLA dashboards, teams have no early warning system to detect when performance is trending toward non-compliance. Service providers struggle to prove adherence, while enterprises lack visibility into whether they’re receiving the reliability they pay for. The result is a reactive posture where SLA governance becomes a reporting exercise rather than a proactive, continuous practice.
Most traditional monitoring systems are built to alert teams after something breaks. In 2026, this reactive approach is no longer sufficient. Networks have become too dynamic, spanning clouds, edges, IoT ecosystems, and AI-driven workloads to rely solely on threshold-based alerts. What’s missing is predictive intelligence which is basically the ability to identify anomalies early, baseline normal behavior over time as well as forecast potential failures before they disrupt operations.
Without AI-driven insights, IT teams are stuck firefighting instead of preventing incidents. Predictive visibility reshapes monitoring from a defensive function into a strategic advantage, thus reducing downtime and enabling teams to stay one step ahead of performance issues.

Overcoming these visibility gaps is essential for ensuring reliable performance and uninterrupted service delivery. With the right platform, IT teams can move from reactive firefighting to proactive, predictive operations. Percipient NMS brings deep observability, automated discovery and AI-driven insights into every layer of the network.
Take the next step toward unified visibility, discover Percipient NMS and strengthen your network for 2026 and beyond.

Technical Content Writer
Driven by a passion for storytelling and technology, I translate complex concepts into clear, impactful narratives. My work revolves around exploring emerging trends, digital transformation, and innovation across industries. With a strong curiosity for tech-driven knowledge and a love for reading, I’m always seeking new ideas that inspire smarter communication and deeper understanding.
info@echelonedge.com
marketing@echelonedge.com


Copyright ©2023 Echelon Edge Pvt Ltd | All Right Reserved | Cookies Policies